Beautiful logging for TypeScript
INFO listening on http://localhost:3000
DEBUG pool acquired conn#7 in 1.2ms
INFO tool search 142ms · 318t
WARN cache miss user:42:profile
ERROR charge failed
PaymentDeclinedError card ending 4242 was declined
error stack:
• billing.ts:140 Billing.charge
/src/billing.ts:140
• checkout.ts:52 Checkout.processOrder
/src/checkout.ts:52
• pay.ts:18 handler
/src/routes/pay.ts:18
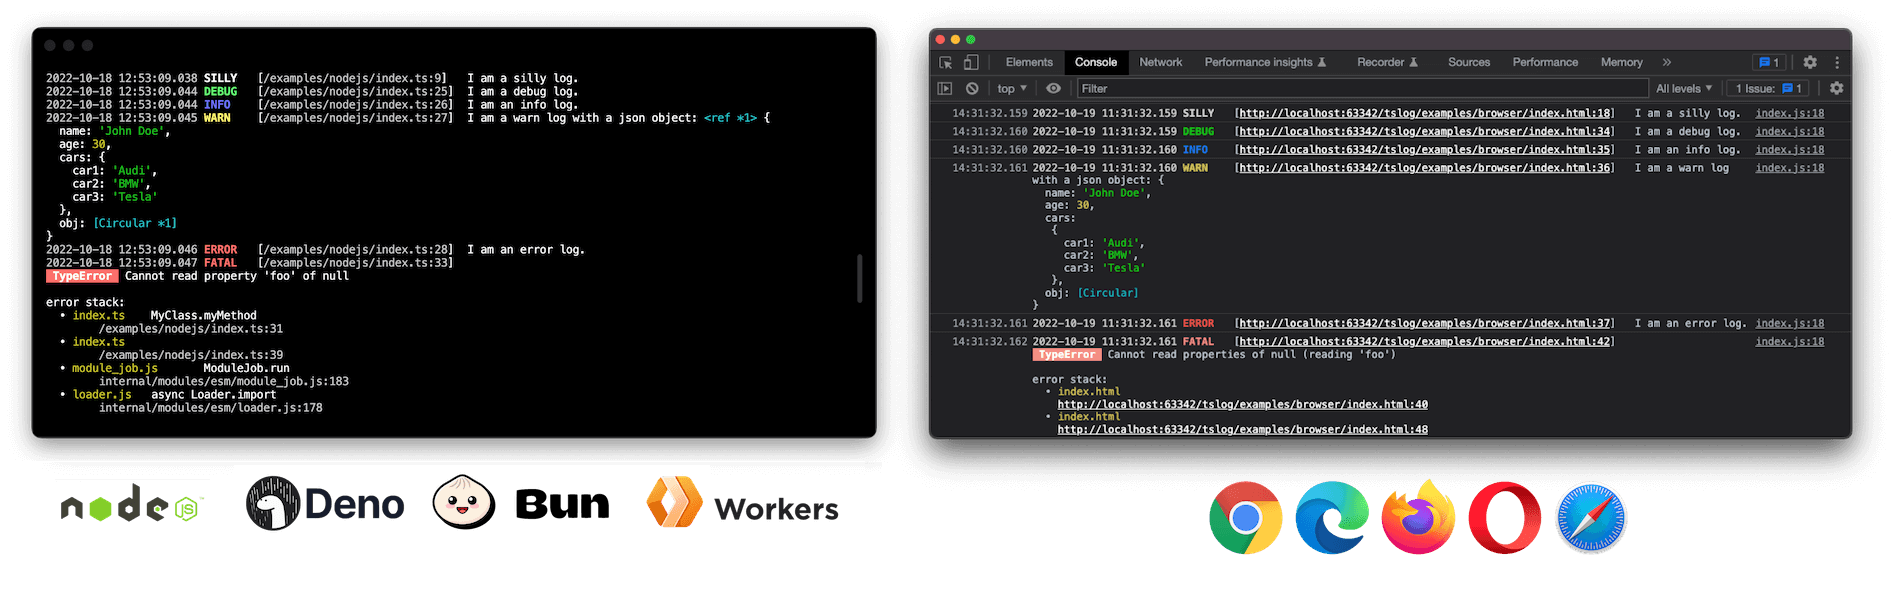
 Node.js
 Deno
Deno Bun
Bun Workers
 React Native









Powerful, fast and expressive logging for TypeScript and JavaScript
Highlights
Section titled “Highlights”- Universal — one logger for Node.js, browser, Deno, Bun, workers and React Native
- Structured, fields-first JSON — flat, observability-ready output that drops straight into log pipelines
- Pretty by default, JSON optional — colored in your terminal, uncolored when piped/CI; structured JSON is one opt-in away
- First-class support for agents & LLMs — fields-first calls, agent/session correlation, an
llms.txt, and OTel-GenAI presets; used by OpenClaw for agent logging - Tree-shakeable subpaths — transports, presets and helpers ship as opt-in modules,
sideEffects: false - Zero runtime dependencies — nothing pulled into your bundle but
tslogitself - Fully typed — written in TypeScript 7, native ESM, accurate source-mapped line numbers
- Secret masking — keys, JSONPath-lite paths, regex, and a hashing censor for correlation
- Sub-loggers with inheritance —
child()/getSubLogger()with merged settings and accumulated names - Pluggable transports & middleware — per-transport level/format, a
use()pipeline,flush()and disposal - Interactive browser objects —
pretty.passObjectsNatively(on by default in browsers) keeps logged objects collapsible in DevTools - Pretty errors & stack traces — structured, fully serializable, captured only when needed (
"auto"for pretty,"off"for JSON)
Example
Section titled “Example”import { Logger } from "tslog";
// `new Logger()` is pretty everywhere: colorized in an// interactive terminal, uncolored when piped/redirected/CI.// Omit `type` for pretty; set "pretty" | "json" | "hidden".const log = new Logger({ minLevel: "INFO" });
// Fields-first OR string-first — both work:log.info({ port: 3000 }, "server started");log.info("server started");
// A child logger per request or agent — name, settings and// fields are inherited. `child(...)` aliases `getSubLogger(...)`:const requestLog = log.getSubLogger({ name: "agent:planner" });requestLog.info({ tool: "search", tokens: 318 }, "tool call done");// JSON → {"message":"tool call done","level":"INFO","levelId":3,// "time":"…","tool":"search","tokens":318,// "_logMeta":{"v":5,"name":"agent:planner",…}}
// Keep secrets, PII and prompts out of your logs (grouped under `mask`):const safeLog = new Logger({ type: "json", mask: { keys: ["password", "apiKey", "token", "prompt"], paths: ["user.password", "*.token"], },});safeLog.info({ user: { name: "Ada", password: "hunter2" } });// → {"user":{"name":"Ada","password":"[***]"},"level":"INFO", …} (a lone object spreads its fields — no message key)Donations help me allocate more time for my open source work.
Install
Section titled “Install”tslog is published to npm as a single ESM package. How you pull it in depends on the runtime — npm for Node.js, bun add for Bun, an npm: specifier (or import map) for Deno, and a CDN URL for the browser:
| Runtime | Install / import |
|---|---|
| Node.js | npm install tslog → import { Logger } from "tslog"; |
| Bun | bun add tslog → import { Logger } from "tslog"; |
| Deno | no install step — import { Logger } from "npm:tslog"; |
| Browser | no install step — import { Logger } from "https://esm.sh/tslog"; |
The per-runtime details are below.
Node.js
Section titled “Node.js”npm install tslogSet "type": "module" in your package.json and run Node with source maps for accurate line numbers:
{ "name": "NAME", "version": "1.0.0", "type": "module", "scripts": { "build": "tsc -p .", "start": "node --enable-source-maps dist/index.js" }, "dependencies": { "tslog": "^5" }}After building (npm run build), start your app with npm start.
To run TypeScript directly, use a current ESM-aware runner, e.g. node --enable-source-maps --import tsx src/index.ts.
There is no install step in Deno — the npm: specifier pulls tslog from npm and caches it on first run (or add it to an import map / deno add npm:tslog if you prefer a bare "tslog" import):
import { Logger } from "npm:tslog";
const logger = new Logger();logger.info("Hello from Deno");deno run main.ts# grant optional metadata access: deno run --allow-env main.tsAdd the package with Bun’s own installer, then import it by name:
bun add tslogimport { Logger } from "tslog";
const logger = new Logger();logger.info("Hello from Bun");bun run main.tsBrowser
Section titled “Browser”<script type="module"> import { Logger } from "https://esm.sh/tslog"; const logger = new Logger(); logger.silly("I am a silly log.");</script>A prebuilt IIFE bundle is also published for <script src="tslog.js"> usage, exposing the global window.tslog. In the browser, the default output renders pretty logs with CSS styling.
Bundle-size sensitive? import { Logger } from "tslog/slim" ships the same structured-JSON pipeline at less than half the size (~9.8KB gzip vs ~20.7KB) by leaving out masking, pretty output, and stack capture — mask settings and type: "pretty" throw there instead of silently degrading. Both sizes are enforced by a CI budget (npm run check-bundle-size).
Enable TypeScript source-map support so tslog can point at the correct line in your source:
{ compilerOptions: { // <!-- here "inlineSourceMap": true, "target": "es2022", },}React Native
Section titled “React Native”npm install tslogWorks out of the box on Hermes and JSC — Metro resolves the react-native entry automatically. tslog detects React Native (_logMeta.runtime: "react-native", with the Hermes engine version when available), parses Hermes/JSC stack frames correctly, and defaults to pretty output in the Metro console.
Which build should I use?
Section titled “Which build should I use?”One package, purpose-built distributions. For most apps the answer is simply tslog: the main entry adapts to where it runs (colorized pretty output in your terminal or devtools, uncolored pretty when piped, and opt-in flat JSON for production — see Default type and colorization), so the same import covers development and production without config. The other builds exist for the situations where the default trade-offs don’t fit:
| Situation | Import | Why |
|---|---|---|
| Development (server, browser, RN) | tslog |
Zero config: colorized pretty output on an interactive TTY / in the devtools console, code positions via stack capture, config validation with did-you-mean hints. |
| Production (services, containers, CI) | tslog |
The very same import: pretty stays uncolored when piped/non-TTY; opt into flat fields-first JSON with type: "json". Add mask for secrets/PII, bindings + runInContext for correlation, and transports to ship logs. |
| Production, size-critical bundles (browser apps, edge workers) | tslog/slim |
The same JSON pipeline at less than half the size (~9.8KB vs ~20.7KB gzip) by leaving out masking, pretty output, and stack capture — and it throws on mask / type: "pretty" instead of silently degrading. Develop against tslog, ship tslog/slim. |
| Testing | tslog/testing |
createTestLogger() captures every record and rendered line for assertions — no console noise, no spies. (Any build also accepts type: "hidden" to mute the console while still returning records.) |
| Browser debugging with native line numbers | tslog/lite |
Thin console wrappers with zero processing, so devtools still shows the caller’s file:line instead of the logger’s. |
| Reading production logs as a human | tslog CLI |
Pipe NDJSON into the bundled bin and get the local pretty rendering: kubectl logs api | npx tslog -l warn. |
All of them speak the same settings language and emit the same JSON shape, so switching between builds is an import change, not a rewrite.
Comparison with other loggers
Section titled “Comparison with other loggers”How tslog compares to the most popular JavaScript loggers. This table looks only at what each library does in its core package, out of the box — because most of these can be extended with plugins, and a fair comparison has to draw the line somewhere. The line is “what you get from a fresh install with no extra packages.”
Legend: ✅ built-in / on by default · ⚪ available, but only by adding a separate plugin or package · 🟡 partial / manual / needs hand-rolling · ❌ not available
| Feature (core feat only) |
tslog | pino | winston | bunyan | consola |
|---|---|---|---|---|---|
| Runtime dependencies | 0 | many | many | heavy (native) | 0 (bundled) |
| Universal (Node + browser + Deno/Bun) | ✅ | 🟡 polyfill |
❌ Node-only |
❌ Node-only |
✅ |
| First-class TypeScript types | ✅ | ✅ | 🟡 loose |
🟡 | ✅ |
| Pretty output in-process | ✅ | ⚪pino-pretty |
✅ | ⚪ CLI pipe |
✅ |
| Structured, fields-first JSON | ✅ | ✅ | 🟡 via formats |
✅ | ❌ |
| Env-aware colorization (color ↔ plain) | ✅ | ❌ | ❌ | ❌ | 🟡 fancy↔basic |
| Secret masking / redaction | ✅ keys · paths · regex |
✅ paths |
🟡 manual format |
❌ | ❌ |
| Pretty errors + stack traces | ✅ | 🟡 | 🟡 | 🟡 | 🟡 |
| Source-mapped call-site line numbers | ✅ | ❌ | ❌ | 🟡src (slow) |
🟡 |
| Sub-loggers with inherited settings | ✅ | 🟡 bound fields |
🟡 child fields |
🟡 bound fields |
❌ |
| Per-transport level / format | ✅ | 🟡 per-target |
✅ | 🟡 per-stream |
❌ |
flush() / disposal |
✅ | ✅ | ❌ | ❌ | ❌ |
| Async-context correlation (ALS) | ✅ | ⚪pino-http |
⚪ | ❌ | ❌ |
| OpenTelemetry / GenAI presets | ✅ | ⚪ | ⚪ | ❌ | ❌ |
| File / HTTP / ring-buffer transports | ✅ subpaths |
✅ targets |
⚪ transports |
🟡 streams |
❌ |
| Off-event-loop (worker-thread) sink | ✅ subpath |
✅ thread-stream |
❌ | ❌ | ❌ |
Ready to switch? Step-by-step guides: Migrating from pino, winston, or consola.
Core concepts
Section titled “Core concepts”Log levels
Section titled “Log levels”tslog ships seven default levels (the exported LogLevel enum):
| id | name | method |
|---|---|---|
| 0 | SILLY | log.silly() |
| 1 | TRACE | log.trace() |
| 2 | DEBUG | log.debug() |
| 3 | INFO | log.info() |
| 4 | WARN | log.warn() |
| 5 | ERROR | log.error() |
| 6 | FATAL | log.fatal() |
import { Logger } from "tslog";
const log = new Logger({ name: "myLogger" });log.silly("I am a silly log.");log.trace("I am a trace log.");log.debug("I am a debug log.");log.info("I am an info log.");log.warn("I am a warn log with an object:", { foo: "bar" });log.error("I am an error log.");log.fatal(new Error("I am a pretty Error with a stacktrace."));
Use minLevel to suppress everything below a threshold (number or name). The LogLevel enum avoids magic numbers:
import { Logger, LogLevel } from "tslog";
// or minLevel: "WARN"const log = new Logger({ minLevel: LogLevel.WARN });log.info("hidden");log.warn("visible");
// change at runtimelog.setMinLevel("DEBUG");
Custom levels declared with customLevels (or added at runtime with addLevel) install real level methods named after the lower-cased level. Use createLogger to get them fully typed, and level names resolve case-insensitively everywhere (minLevel, isLevelEnabled):
import { createLogger } from "tslog";
const log = createLogger({ customLevels: { AUDIT: 8, METRIC: 9 } });// typed methodlog.audit({ actor: "ada" }, "deleted account");// runtime registration, chainablelog.addLevel("NOTICE", 3.5).notice("heads up");
// any casing worksconst quiet = new Logger({ customLevels: { AUDIT: 8 }, minLevel: "audit" });
The generic log(levelId, levelName, ...args) dispatch still works; a call whose id drifts from the registered one warns in development. Names that collide with a logger member (log, flush, …), a canonical level, or another registered level in a different casing are rejected at construction.
Sub-loggers — child() / getSubLogger()
Section titled “Sub-loggers — child() / getSubLogger()”A sub-logger inherits the parent’s settings (group-merged) and default logObj. Names accumulate into _logMeta.parentNames, so you can trace which module or request produced a line. child() is an alias for getSubLogger().
Bind static fields with bindings: they land on every JSON record, merge down the child chain, always lose to per-call fields on a collision, and are masked once with the logger’s mask settings.
const main = new Logger({ name: "app", bindings: { service: "checkout" } });const db = main.getSubLogger({ name: "db" });const query = db.child({ name: "query", minLevel: "DEBUG", bindings: { pool: "primary" } });query.info("slow query", { ms: 812 });// → {"message":"slow query","ms":812,"service":"checkout","pool":"primary",…}
query.debug("select 1");// _logMeta.name = "query", _logMeta.parentNames = ["app", "db"]
You can override the default logObj per child by passing a second argument: main.getSubLogger({ name: "worker" }, { tenant: "acme" }).
Settings are grouped
Section titled “Settings are grouped”v5 settings are organized into groups — there are no flat keys like prettyLogTemplate, maskValuesOfKeys, or hideLogPositionForProduction anymore. Top-level keys cover identity and routing; the groups cover everything else.
Top-level: type ("pretty" | "json" | "hidden" — omit for pretty everywhere, colored on a TTY), name, parentNames, minLevel, argumentsArrayName, prefix (string args prepended to every call and concatenated down the child chain — use bindings for JSON fields, prefix for message text), bindings (static bound fields — merged down the child chain, per-call fields win, masked once at construction), attachedTransports, middleware, customLevels, persistLevel / persistLevelKey (browser-only — persist runtime setMinLevel() changes in localStorage and restore on reload), contextStorage (bring-your-own AsyncLocalStorage for runInContext — the Cloudflare Workers seam), clock (injectable () => Date — deterministic tests, offset/monotonic stamping), strictConfig (throw a typed TslogConfigError on bad config — including unknown/typo’d keys and carried-over v4 flat keys, which otherwise warn in development with a did-you-mean suggestion).
| Group | Keys |
|---|---|
pretty |
template, placeholders, errorTemplate, errorStackTemplate, errorParentNamesSeparator, errorLoggerNameDelimiter, style (boolean), timeZone ("UTC" | "local"), styles, levelMethod, passObjectsNatively (boolean), inspectOptions, enabled |
json |
messageKey ("message"), levelKey ("level"), levelIdKey ("levelId"), timeKey ("time"), time ("iso" | "epoch" | false | fn), errorKey ("error"), numericLevel (true), stableKeyOrder (false) |
mask |
keys ([]), caseInsensitive, regex (RegExp[]), placeholder ("[***]"), paths (JSONPath-lite), censor (string | "remove" | "hash" | fn), hashLabel ("hash") |
stack |
capture ("off" | "lazy" | "auto" | "full"), internalFramePatterns (RegExp[]) |
meta |
property ("_logMeta"), attachContext |
const log = new Logger({ type: "json", name: "api", minLevel: "INFO", json: { messageKey: "msg", timeKey: "ts" }, mask: { keys: ["password"], censor: "hash" }, stack: { capture: "lazy" },});Default type and colorization
Section titled “Default type and colorization”When type is omitted, tslog defaults to pretty everywhere — a pipe, a redirect, CI, or docker logs are still read by a human most of the time, so that is what you get by default. Only the coloring is environment-aware:
- Interactive TTY →
pretty, colorized - Piped / redirected / CI (non-TTY) →
pretty, uncolored (no ANSI escapes leak into your file or log collector) - Browser / React Native →
pretty(CSS styling in the browser)
Structured json is a deliberate production choice, so it is opt-in — set type: "json", run with TSLOG_TYPE=json (via Logger.fromEnv()), or attach a JSON transport/sink. NO_COLOR follows no-color.org semantics: it switches colors off, never the format. FORCE_COLOR forces colorized pretty. Both apply to new Logger() and the ready-made log export. Logger.fromEnv(overrides?) additionally reads TSLOG_LEVEL / TSLOG_TYPE / TSLOG_NAME (overrides win).
Source-mapped error positions (Node, Bun & Deno)
Section titled “Source-mapped error positions (Node, Bun & Deno)”When you log an Error thrown from transpiled or bundled TypeScript (tsc, esbuild, webpack, Rollup, Next.js — including Turbopack — TanStack Start, etc.), tslog resolves the reported file/line/column back through that file’s source map, so _logMeta.path and the pretty error stack point at your original .ts source instead of the compiled output — the same thing your browser devtools already do for console.log, that Node’s own V8 stack rewriting only does when the process is started with --enable-source-maps, and that Bun does not do at all for its own stack traces.
Resolution runs automatically outside production (NODE_ENV !== "production") on Node, Bun, and Deno — never in the browser, where devtools already own it. Both flat and indexed (sections) maps are supported — the format Turbopack and other concatenating bundlers emit, including per-section external sub-maps — and bundler-virtual source paths (webpack://_N_E/./src/x.ts, [project]/src/x.ts) are reduced to clean project-relative paths. Each resolved file’s source map is parsed once and cached; a file with no //# sourceMappingURL= comment costs one failed read, then nothing. Override the default with TSLOG_SOURCE_MAPS=on or TSLOG_SOURCE_MAPS=off when you need it forced independent of NODE_ENV (e.g. to keep it on in a staging deploy, or off during a benchmark).
First-class support for agents & LLMs
Section titled “First-class support for agents & LLMs”tslog treats LLM apps and coding agents as a primary use case — it’s used by OpenClaw, an AI agent platform, for its agent logging:
-
llms.txtships in the package, giving agents an accurate, condensed API surface to work from. -
Fields-first calls make structured, queryable logs the natural default for tool calls and traces.
-
isLevelEnabled(level)guards expensive payloads (token counts, large prompts) without building them:if (log.isLevelEnabled("DEBUG")) {log.debug({ prompt: buildExpensivePrompt() });} -
defineConfig(...)gives a typed, validated settings object you can share across loggers. -
Request / agent correlation via
runInContext(ctx, fn)(Node ALS). Context fields attach to_logMetaby default (meta.attachContext; set it tofalseto keep them out of the output), so every log inside the callback carries the same correlation id:const log = new Logger();await log.runInContext({ requestId: "abc123" }, async () => {// _logMeta carries requestIdlog.info("handling request");await doWork();});// read active context fields (e.g. for OTel span correlation)const { requestId } = log.getContext();runInContextpropagates on Node, Deno, and Bun automatically. On runtimes whereAsyncLocalStoragecannot be auto-resolved — most notably Cloudflare Workers — inject one via thecontextStoragesetting (requires thenodejs_alsornodejs_compatcompatibility flag):import { AsyncLocalStorage } from "node:async_hooks";const log = new Logger({ contextStorage: new AsyncLocalStorage() });Where neither is available (browsers),
runInContextstill runs the function — it just propagates nothing, and warns once in development.
Structured JSON output
Section titled “Structured JSON output”tslog’s JSON is flat and fields-first — message, level and time at the top, your fields spread next to them, and runtime metadata nested under _logMeta with a schema version (v: 5).
const log = new Logger({ type: "json" });log.info({ userId: 42 }, "hi");{ "message": "hi", "level": "INFO", "levelId": 3, "time": "2026-06-29T22:37:07.599Z", "userId": 42, "_logMeta": { "v": 5, "runtime": "node", "runtimeVersion": "24.15.0", "hostname": "api-7f9c4", "date": "2026-06-29T22:37:07.599Z", "logLevelId": 3, "logLevelName": "INFO" }}How arguments map to output:
| Call | Result |
|---|---|
log.info("hi") |
message: "hi" |
log.info({ a: 1 }) |
fields spread top-level: a: 1 |
log.info({ a: 1 }, "hi") |
fields spread + message: "hi" |
log.info("a", "b") |
message: "a", "1": "b" |
log.error(new Error("x")) |
serialized under error (cause chain preserved) |
name / parentNames only appear when set (no [undefined] noise). Every key name is configurable via the json group, so you can match an existing schema:
new Logger({ type: "json", json: { messageKey: "msg", levelKey: "severity", timeKey: "@timestamp", errorKey: "err" },});Timestamps & the clock seam
Section titled “Timestamps & the clock seam”The top-level timestamp representation is configurable via json.time (the _logMeta.date inside the
runtime block always stays a UTC ISO string), and the clock itself is injectable:
// "time": 1751191872000 (pino-style ms)new Logger({ type: "json", json: { time: "epoch" } });
// no top-level time key (diff-friendly)new Logger({ type: "json", json: { time: false } });
// ns for Lokinew Logger({ type: "json", json: { time: (d) => String(BigInt(d.getTime()) * 1_000_000n) } });
// frozen clock — deterministic testsnew Logger({ clock: () => new Date(0) });
A throwing/invalid clock or time function never breaks logging (the runtime date / ISO string is
kept). Sub-loggers inherit the parent’s clock.
Batched stdout on Node
Section titled “Batched stdout on Node”On the Node entry, type: "json" lines are written through a buffered stdout sink: a whole
event-loop turn’s lines are batched into one process.stdout.write (flushing early past ~8 KB), which
removes the per-line console.log overhead that dominates logger throughput. Delivery is safeguarded:
await logger.flush() (and await using) resolves only after stdout accepted everything, and
process.exit() / uncaught exceptions trigger a synchronous drain via exit hooks. Note that code
intercepting console.log will no longer see JSON output on Node — spy on process.stdout.write, or
use type: "hidden" plus a transport. Browser/universal (Deno, Bun, workers) builds keep console.log.
Masking secrets
Section titled “Masking secrets”One of the most common ways secrets leak is through logs. Configure masking once on the logger and it applies recursively to every log. All masking lives under the mask group.
const log = new Logger({ type: "json", mask: { // mask by key name keys: ["password", "apiKey", "token"], // also match Password, TOKEN, … caseInsensitive: true, // mask by value pattern regex: [/Bearer\s+[A-Za-z0-9._-]+/], // JSONPath-lite, "*" wildcard paths: ["user.password", "*.token"], // replacement (default) placeholder: "[***]", },});Masking is leak-proof by construction:
regexpatterns are always applied globally: every occurrence in a string is redacted, whether or not you wrote thegflag.- Shared references and circular structures resolve to the same masked clone, so a secret can never escape through a second reference to the same object.
keysandregexalso apply insideMapandSetcontents (pathsdoes not descend into them).- Errors are masked like any other object. A logged
Error, top-level or nested, is replaced by a masked clone and the caller’s instance stays untouched.regexcovers themessageand the<name>: <message>header of a V8-style stack, but never the frames, so a broad pattern cannot corruptline:colpositions.keys,regexandpathscover every other own property (code,extensions, …) and thecausechain.keysskipsname,messageandstack, sokeys: ["name"]does not blank every error, whilepathscan still target them (paths: ["message"]).
The censor option controls how a paths-matched value is replaced (keys- and regex-matched values always use placeholder, with one exception below):
- a string — replace with that literal
"remove"— drop the key entirely- a function — custom logic returning the replacement
"hash"— replace with a fast, synchronous, non-cryptographic correlation token (e.g."[hash:1a2b3c4d]", label configurable viahashLabel) so you can correlate a redacted value across logs without ever storing it."hash"is the one censor that also applies tokeysmatches, somask.keysandmask.pathshash alike
const log = new Logger({ mask: { keys: ["ssn"], censor: "hash", hashLabel: "hash" } });Transports
Section titled “Transports”A transport receives every (level-permitted) log record and decides where it goes — a file, an HTTP endpoint, an in-memory buffer, Slack, anything. tslog ships file, HTTP, ring-buffer and worker-thread transports as tree-shakeable subpaths, and you can write your own against the Transport contract.
interface Transport<LogObj> { name?: string; // per-transport level minLevel?: number | TLogLevelName; // per-transport format format?: "pretty" | "json" | LogFormatter<LogObj>; write(record, line): void | Promise<void>; flush?(): Promise<void>; [Symbol.asyncDispose]?(): Promise<void>;}line is the record rendered in the transport’s format (the logger’s type when unset; json for hidden). A "pretty" line is always plain text: the ANSI colors a TTY console gets never reach a file, HTTP or buffer sink.
attachTransport accepts a full Transport object or a bare function, and returns a detach function:
const log = new Logger();
const detach = log.attachTransport((record) => {  myQueue.push(record);});
// laterdetach();
Transports are isolated (a throwing transport cannot break logging) and inherited by sub-loggers. Flush buffered transports and dispose cleanly:
await log.flush();
// or scoped disposal:await using scoped = new Logger({ /* ... */ });
Delivery guarantees: log.flush() awaits in-flight async transport writes as well as each transport’s own flush(). Disposing a sub-logger flushes shared transports but only disposes the ones the child itself attached. The built-in transports register guarded exit hooks by default: the file transport drains synchronously even on process.exit(...) or an uncaught exception (and never crashes the process on fs errors — they are contained, reported via onError, and the open is retried); the http transport bounds every request with a timeout, retries with backoff, caps its buffer (oldest lines drop first), and flushes on beforeExit/pagehide; the worker transport keeps its thread unref’d so it never blocks process exit, drains on beforeExit, and survives a dead worker by respawning (then falling back to inline writes).
Built-in transport subpaths
Section titled “Built-in transport subpaths”// Node, non-blockingimport { fileTransport } from "tslog/transports/file";// batched fetchimport { httpTransport } from "tslog/transports/http";// in-memoryimport { ringBufferTransport } from "tslog/transports/ringbuffer";// Node, off-thread sink I/Oimport { workerTransport } from "tslog/transports/worker";
const log = new Logger();log.attachTransport(fileTransport({ path: "app.log", append: true }));log.attachTransport(httpTransport({ url: "https://logs.example.com", batchSize: 50, flushIntervalMs: 1000 }));
const ring = ringBufferTransport({ size: 200 });log.attachTransport(ring);// ring.dump(); ring.clear();
// Run the destination write on a worker thread so slow sink I/O doesn't block the event loop under high volume.// Note: this does NOT speed up `log.info()` —// the record is still built and serialized on the main thread; only the file/stream write moves// off-thread. `flush()` drains the worker; `await using` (or attachTransport's detach) cleans it up.log.attachTransport(workerTransport({ destination: "file", path: "app.log", format: "json" }));Middleware & pipeline
Section titled “Middleware & pipeline”logger.use(middleware) appends a middleware to the pipeline. A middleware receives the log context (args, meta, settings, logLevelId, logLevelName), and can mutate it or drop the log by returning null / false:
const log = new Logger();
// enrich every log (meta is free-form scratch space attached under _logMeta)log.use((ctx) => {  ctx.meta.env = process.env.NODE_ENV;  return ctx;});
// drop noisy health checks (args holds the log call's arguments)log.use((ctx) => (ctx.args[0] === "/health" ? null : ctx));
For custom output formatting, set format on a transport (a "pretty" | "json" string or a LogFormatter function) rather than overriding a global transport.
Presets
Section titled “Presets”Presets are tree-shakeable subpaths that emit logs in a foreign schema, so tslog drops into existing tooling. They are off by default — import and wire them explicitly.
pino — tslog/presets/pino
Section titled “pino — tslog/presets/pino”pinoFormat() produces pino-compatible NDJSON (integer level 10–60, time epoch ms, msg), so pino-pretty and pino transports keep working. pinoTransport() wires it up in one call; toPinoLevel(id) maps a tslog level id to its pino number.
import { pinoFormat, pinoTransport } from "tslog/presets/pino";
const log = new Logger();// or attach a transport with { format: pinoFormat() }log.attachTransport(pinoTransport((line) => process.stdout.write(line + "\n")));
Errors are emitted in pino’s serializer shape — err: { type, message, stack } with stack as the
raw multi-line string (what pino-pretty, Datadog, GCP Error Reporting, and Sentry parse), cause
chain recursed. Prefer tslog’s structured frame arrays instead? pinoFormat({ errorShape: "tslog" }).
OpenTelemetry — tslog/otel
Section titled “OpenTelemetry — tslog/otel”otlpFormat() / toOtlpJson() emit real OTLP/JSON — the resourceLogs[].scopeLogs[].logRecords[]
envelope with camelCase proto3 fields, typed attributes, exception.* semconv mapping for logged
errors, and correct severityNumbers — so batches POST straight to a collector’s /v1/logs:
import { otelTraceContext, otlpBatchBody, otlpFormat } from "tslog/otel";import { httpTransport } from "tslog/transports/http";
const log = new Logger({ type: "hidden" });log.attachTransport(  httpTransport({    url: "http://collector:4318/v1/logs",    format: otlpFormat({ resource: { "service.name": "checkout" } }),    // merges each batch into ONE OTLP envelope per POST    encodeBody: otlpBatchBody,  }),);// trace correlation (`trace` from @opentelemetry/api)log.use(otelTraceContext({ getSpanContext: () => trace.getActiveSpan()?.spanContext() }));
otelFormat() / toOtelRecord() additionally emit the data-model prose shape (Timestamp, Body,
Attributes, …) for custom pipelines — note that shape is not a wire format and collectors will not
ingest it directly.
GenAI / agents — tslog/presets/genai
Section titled “GenAI / agents — tslog/presets/genai”genai() / genaiAttributes() / genaiSummary() build OTel-GenAI semantic-convention attributes (gen_ai.*: model, tokens, tool calls) for LLM and agent apps.
import { genai } from "tslog/presets/genai";
log.info(genai({ model: "claude", inputTokens: 318, outputTokens: 142 }), "completion");
Integrations: Next.js/TanStack Start, Sentry & Better Stack
Section titled “Integrations: Next.js/TanStack Start, Sentry & Better Stack”Next.js, TanStack Start (and other full-stack frameworks)
Section titled “Next.js, TanStack Start (and other full-stack frameworks)”Use the full Logger on the server and tslog/lite in "use client" components — two files, no other setup:
// lib/logger.server.ts — route handlers, server components, server actionsimport "server-only"; // optional guard: importing this from client code fails the buildimport { Logger } from "tslog";
export const log = new Logger({  name: "app",  type: process.env.NODE_ENV === "production" ? "json" : "pretty",});
// lib/logger.client.ts — "use client" componentsimport { createLiteLogger } from "tslog/lite";
export const log = createLiteLogger({ name: "app", minLevel: process.env.NODE_ENV === "production" ? "WARN" : "SILLY",});
// per-area sub-loggers work here too, labeling lines "app:cart":export const cartLog = log.getSubLogger({ name: "cart" });Server-side you get the full pipeline — pretty output with original .ts positions in dev (Turbopack source maps work out of the box), structured JSON for collectors in production. Client-side, tslog/lite’s level methods are the bound native console.* methods, so the file:line badge devtools attaches to each log points at your component (source-mapped by devtools) and logged objects stay live and collapsible. getSubLogger() keeps that property — it binds the name onto the native method instead of wrapping it. One trade-off of that binding: the label occupies the console’s format-string slot, so printf-style specifiers (%d, %s, %c) in messages print literally on a named lite logger — see RECIPES.md for details. The same split works for TanStack Start and other Vite-SSR frameworks.
Retrofitting a codebase that already imports one shared logger module everywhere: keep that single entrypoint and let a browser conditional imports subpath pick the half, so no call site changes. Don’t reach for the react-server condition — it covers only Server Components, and silently hands route handlers and server actions the client logger. That variation, plus client-side sub-loggers and shipping client logs to Sentry, in RECIPES.md.
Error trackers and log platforms plug in as transports — no vendor-specific logger needed. Two worked examples follow; the same two patterns (a write function for SDK-based services, httpTransport for HTTP ingestion APIs) cover Datadog, Loki, Axiom and friends.
Sentry
Section titled “Sentry”Sentry has two ingestion paths: issues (error tracking) and Sentry Logs (structured logs, searchable next to your traces). A tslog transport covers each — run one or both.
Errors → Sentry issues. Forward ERROR/FATAL records while keeping your normal console/JSON output. The record a transport receives still carries the native Error instance (as nativeError on the serialized error), so Sentry gets the real exception — full stack and cause chain, proper issue grouping — not a stringified copy. With mask configured, nativeError is the masked clone: still a real Error with the same stack and cause chain, so grouping works and secrets stay out of Sentry too:
import * as Sentry from "@sentry/node";import { Logger } from "tslog";
Sentry.init({ dsn: process.env.SENTRY_DSN });
const log = new Logger();
log.attachTransport({  name: "sentry",  // only errors and fatals leave the process  minLevel: "ERROR",  // `line` becomes the flat JSON record, independent of the console output  format: "json",  write(record, line) {    const { _logMeta, ...fields } = JSON.parse(line);    const level = _logMeta.logLevelName === "FATAL" ? "fatal" : "error";    const nativeError = [record, ...Object.values(record)]      .map((value) => (value as { nativeError?: unknown } | null)?.nativeError)      .find((candidate): candidate is Error => candidate instanceof Error);    if (nativeError) {      Sentry.captureException(nativeError, { level, extra: fields });    } else {      Sentry.captureMessage(String(fields.message ?? line), { level, extra: fields });    }  },});
// → console output + a Sentry issue, logged fields as `extra`log.error(new Error("payment failed"));
Everything → Sentry Logs. Enable logs in Sentry.init (enableLogs: true, current @sentry/node) and forward every record through Sentry.logger.* — the seven tslog levels map one-to-one, with SILLY joining trace:
import * as Sentry from "@sentry/node";import { Logger } from "tslog";
Sentry.init({ dsn: process.env.SENTRY_DSN, enableLogs: true });
const log = new Logger();const toSentry = { SILLY: "trace", TRACE: "trace", DEBUG: "debug", INFO: "info", WARN: "warn", ERROR: "error", FATAL: "fatal" } as const;
log.attachTransport({  name: "sentry-logs",  // `line` is the flat JSON record; its fields become Sentry log attributes  format: "json",  write(_record, line) {    const { _logMeta, message, ...attributes } = JSON.parse(line);    const method = toSentry[_logMeta.logLevelName as keyof typeof toSentry] ?? "info";    Sentry.logger[method](String(message ?? ""), attributes);  },});
// → console output + a Sentry log with a `userId` attributelog.info({ userId: 42 }, "user logged in");
Run both transports side by side: every record becomes a searchable Sentry log, and ERROR/FATAL additionally become issues. Because transports are inherited, every sub-logger reports to Sentry too — and transport isolation means a Sentry outage can never break your logging.
Better Stack (Logtail)
Section titled “Better Stack (Logtail)”Better Stack ingests JSON over HTTP, so the built-in httpTransport is all you need. It reads the timestamp from a dt field and the message from message — the first is one json setting away, the second is tslog’s default:
import { Logger } from "tslog";import { httpTransport } from "tslog/transports/http";
const log = new Logger({  type: "json",  // Better Stack reads the timestamp from "dt"  json: { timeKey: "dt" },});
log.attachTransport(  httpTransport({    // use the ingesting host shown on your source's settings page    url: "https://in.logs.betterstack.com",    headers: { authorization: `Bearer ${process.env.BETTER_STACK_SOURCE_TOKEN}` },    format: "json",    // Better Stack accepts a JSON array of events per request    bodyFormat: "array",    batchSize: 50,    flushIntervalMs: 2000,  }),);
log.info({ userId: 42 }, "user logged in");// → stdout JSON + batched POSTs; "userId" lands as a queryable column
// drain the buffer before shutdown (await using does this automatically)await log.flush();
The transport batches, retries with exponential backoff, bounds every request with a timeout, caps its buffer, and flushes on beforeExit/pagehide — see Transports. Field names are yours to shape if your dashboards expect different columns, e.g. json: { levelKey: "severity" }.
Pretty output & templates
Section titled “Pretty output & templates”Pretty output is configured entirely under the pretty group. Templates use {{placeholder}} tokens and per-placeholder styles.
const log = new Logger({ type: "pretty", pretty: { template: "{{dateIsoStr}}\t{{logLevelName}}\t[{{filePathWithLine}}{{name}}]\t", errorTemplate: "\n{{errorName}} {{errorMessage}}\nstack:\n{{errorStack}}", errorStackTemplate: " • {{fileName}}\t{{method}}\n\t{{filePathWithLine}}", style: true, timeZone: "UTC", styles: { logLevelName: { "*": ["bold", "black", "bgWhiteBright", "dim"], SILLY: ["bold", "white"], DEBUG: ["bold", "green"], INFO: ["bold", "blue"], WARN: ["bold", "yellow"], ERROR: ["bold", "red"], FATAL: ["bold", "redBright"], }, name: ["white", "bold"], }, },});Route levels to specific console methods with pretty.levelMethod:
new Logger({ type: "pretty", pretty: { levelMethod: { WARN: console.warn, ERROR: console.error, FATAL: console.error, "*": console.log }, },});On Node.js, object formatting uses native util.inspect; tune it with pretty.inspectOptions. For example, pretty.inspectOptions.breakLength controls when inspected objects wrap onto multiple lines — set it high (e.g. Infinity) to keep an object on a single line while preserving color, which is handy in log aggregators (CloudWatch, Datadog) that treat each line as one entry.
Custom placeholders (pretty.placeholders)
Section titled “Custom placeholders (pretty.placeholders)”pretty.placeholders adds your own {{tokens}} to pretty.template. Each callback gets the record’s meta and the resolved pretty settings and returns the value to render (a string or number); style it through pretty.styles like a built-in token, so a composite value such as HH:mm:ss.SSS is colored as one unit:
const log = new Logger({ pretty: { template: "{{shortTime}} {{logLevelName}} ", placeholders: { shortTime: (meta) => meta.date.toISOString().slice(11, 23) }, // UTC; read `pretty.timeZone` for local time styles: { shortTime: "blackBright" }, },});Only tokens the template references are evaluated, once per formatting pass, and a callback that throws renders an empty value, so a display extension can never drop a log. Built-in names are reserved, sub-loggers inherit the parent’s map (a child entry with the same name wins), and the tokens apply to the meta template only — not to the error templates or to JSON output. strictConfig: true rejects reserved names, non-callback entries and misspelled pretty.styles keys (UNKNOWN_PRETTY_STYLE); otherwise they warn in development.
Interactive objects in the browser console (pretty.passObjectsNatively)
Section titled “Interactive objects in the browser console (pretty.passObjectsNatively)”In a real browser (window + document present), pretty output hands non-Error arguments to the console method by reference — the styled meta prefix is still printed, but objects and arrays stay live, so DevTools renders them as the collapsible, clickable trees you’d get from a raw console.log(obj). This is pretty.passObjectsNatively, and it is on by default in browsers (best DX out of the box) and off everywhere else — Node, workers/edge runtimes, and React Native typically capture console output as text, where a raw reference degrades to [object Object].
new Logger({  type: "pretty",  pretty: {    // on by default in browsers — pair with levelMethod so warn/error use the    // console methods that attach an expandable stack group:    levelMethod: { WARN: console.warn, ERROR: console.error, FATAL: console.error },  },});
log.info("user loaded", { id: 42, roles: ["admin"] }); // object is collapsible in DevTools
While it’s on, inspectOptions does not apply to those arguments (the console owns the rendering); logged Errors are still formatted through the pretty error template.
When to switch it off (pretty: { passObjectsNatively: false }) — the rendered-string mode has two properties the native mode gives up:
- Log-time snapshots. DevTools renders a raw reference lazily: if the object mutates after the log call, expanding it shows the current state, not what you logged — the classic
console.loggotcha. Rendering into the string freezes the value at log time. (Withmaskconfigured, arguments are masked clones, so they’re frozen either way.) - Text-matchable logs. The DevTools filter box and any console-capturing harness (test runners, screenshot-based tooling) only match the rendered string — field values inside natively-passed objects are invisible to them.
Conditional logging (log.if(condition))
Section titled “Conditional logging (log.if(condition))”log.if(condition) returns the logger when condition is truthy and a no-op stand-in when it is falsy, so a per-call condition reads as a fluent chain instead of an if statement or a throwaway helper:
log.if(!ok).info("action failed", { id });log.if(retries > maxRetries).warn("giving up", { retries });The falsy stand-in still evaluates its arguments, so to skip expensive payload construction use isLevelEnabled instead — it short-circuits before the arguments are built. if() gates a single call; it isn’t meant to be chained ahead of getSubLogger/child.
Other subpaths
Section titled “Other subpaths”| Import | What it gives you |
|---|---|
tslog/lite |
lite (ready instance), LiteLogger, createLiteLogger(opts?) — minimal console wrappers with named getSubLogger/child, no mask/stack/clone, preserves native console line numbers |
tslog/slim |
Logger, createLogger — the smallest structured-JSON build: the full pipeline (levels, sub-loggers, bindings, custom levels, middleware, runInContext, transports) at less than half the bundle size, minus masking/pretty/stack capture (mask and type: "pretty" throw instead of silently degrading) |
tslog/testing |
createTestLogger(settings?, { now?, normalize? }) → { logger, logs, lines, clear }, plus mockLogger(settings?) and normalizeMeta(recordOrLine) for snapshot-stable output |
tslog/throttle |
throttle({ windowMs, key?, now? }) middleware (off by default), defaultThrottleKey |
tslog/serializers |
stdSerializers { err, req, res, user }, the serialize(map) middleware helper, and the individual serializers |
tslog/pretty/box |
box(content, opts?), tree(node, opts?) for boxed / tree-rendered output |
tslog/console |
wrapConsole(logger), restoreConsole(), isConsoleWrapped() — route console.* through tslog |
bin tslog (tslog/cli) |
NDJSON pretty-printer for stdin, with a -l/--level filter |
import { createTestLogger } from "tslog/testing";
const { logger, logs, lines, clear } = createTestLogger({ type: "json" });logger.info({ ok: true }, "tested");// logs[0] is the captured record: logs[0]._logMeta.logLevelName === "INFO"// lines[0] is the rendered line and contains the fields: lines[0].includes('"ok":true')
Performance
Section titled “Performance”The defaults are tuned for a great developer experience; for hot production paths, the biggest lever is stack capture.
- Batched stdout by default (Node). JSON lines are buffered and written to stdout once per event-loop turn instead of one
console.logper line, with flush/exit-hook safeguards (see Batched stdout on Node above). - Stack capture only when it’s needed. Pretty output defaults to
stack: { capture: "auto" }— frames are captured only when the rendered template actually shows a code position — andtype: "json"defaults to"off", so production JSON pays nothing. - The stack lever. Set
stack: { capture: "off" }to skip code-position capture entirely on hot paths,"lazy"to capture cheaply and defer parsing until something reads the frames, or"full"when you want complete frames for debugging. - Tree-shakeable everything. Presets, transports and helpers are opt-in subpaths with
sideEffects: false, so unused features never reach your bundle.
Benchmarks are run internally against pino, winston, bunyan, and consola, but the raw numbers aren’t published — they vary too much by machine and workload to be a fair, stable comparison to share.
Migrating from pino, winston, or consola
Section titled “Migrating from pino, winston, or consola”Switching loggers is mostly a mapping exercise, and tslog’s call signature is deliberately forgiving: a two-argument call pairing a message string with a plain fields object spreads the fields at the top level in either order, so pino-style log.info({ userId: 42 }, "hi") and winston-style log.info("hi", { userId: 42 }) produce the same flat JSON. Most call sites survive a migration untouched — the work is in the constructor. (Coming from tslog v4? See Upgrading from v4 instead.)
From pino
Section titled “From pino”pino and tslog v5 share the fields-first call shape and the flat-JSON philosophy, so call sites carry over as-is:
// ── pino ──import pino from "pino";const logger = pino({  level: "info",  redact: { paths: ["user.password", "*.token"], censor: "[Redacted]" },});logger.info({ userId: 42 }, "user logged in");const db = logger.child({ module: "db" });
// ── tslog v5 ──import { Logger } from "tslog";const logger = new Logger({ minLevel: "INFO", mask: { paths: ["user.password", "*.token"], placeholder: "[Redacted]" },});// unchangedlogger.info({ userId: 42 }, "user logged in");const db = logger.child({ name: "db", bindings: { module: "db" } });| pino | tslog v5 |
|---|---|
level: "info" |
minLevel: "INFO" — names resolve case-insensitively |
numeric levels trace(10)…fatal(60) |
SILLY(0)…FATAL(6); the pino preset maps them back to 10–60 on the wire |
redact: { paths, censor } |
mask: { paths, placeholder } — same * wildcard, plus keys and regex matching pino doesn’t have |
redact with remove: true |
mask: { censor: "remove" } |
child({ module: "db" }) |
child({ bindings: { module: "db" } }) — children inherit settings too, not just bound fields |
messageKey / timestamp options |
json: { messageKey, time } ("epoch", "iso", or a function) |
pino-pretty for dev |
built in — omit type and you get pretty output everywhere, TTY or not; set type: "json" when you want structured output |
transport: { target: "pino/file" } |
fileTransport(...) from tslog/transports/file; off-thread sink I/O via tslog/transports/worker |
pino.stdSerializers.err/req/res |
stdSerializers from tslog/serializers |
logger.flush(cb) |
await logger.flush() |
Keep your pipeline running while you switch. If dashboards, shippers or pino-pretty expect pino’s exact wire shape (level: 30, epoch-ms time, msg, err), attach the preset instead of reshaping by hand — the output stays pino-compatible while tslog becomes the producer:
import { pinoTransport } from "tslog/presets/pino";
const logger = new Logger({ type: "hidden" });logger.attachTransport(pinoTransport((line) => process.stdout.write(line + "\n")));
From winston
Section titled “From winston”winston call sites keep working — logger.info("payment accepted", { orderId: 7 }) spreads the fields object in tslog too. What disappears is the format.combine() pipeline: output shape, timestamps and colors are settings, not composed formats.
// ── winston ──import winston from "winston";const logger = winston.createLogger({  level: "info",  format: winston.format.combine(winston.format.timestamp(), winston.format.json()),  defaultMeta: { service: "checkout" },  transports: [    new winston.transports.Console(),    new winston.transports.File({ filename: "error.log", level: "error" }),  ],});logger.info("payment accepted", { orderId: 7 });
// ── tslog v5 ──import { Logger } from "tslog";import { fileTransport } from "tslog/transports/file";
const logger = new Logger({ // or omit for pretty everywhere (JSON is opt-in) type: "json", minLevel: "INFO", bindings: { service: "checkout" },});logger.attachTransport(fileTransport({ path: "error.log", format: "json", minLevel: "ERROR" }));// unchangedlogger.info("payment accepted", { orderId: 7 });| winston | tslog v5 |
|---|---|
npm levels error(0)…silly(6) — priority, descending |
SILLY(0)…FATAL(6) — severity, ascending; stick to names and the direction never bites |
http / verbose levels |
closest built-in for verbose is trace; add your own via customLevels: { HTTP: 2.5 } |
defaultMeta |
bindings (also per child: child({ bindings })) |
format.json() + format.timestamp() |
type: "json" + the json group (messageKey, timeKey, time, …) |
format.colorize() + format.simple() |
type: "pretty" — or omit type; pretty is the default (colored on a TTY, uncolored when piped) |
format.printf(...) / custom formats |
use() middleware to mutate or drop records; per-transport format for custom rendering |
transports: [...] with per-transport level / format |
attachTransport({ minLevel, format, write }) — same idea, and it returns a detach function |
custom Transport subclass (stream machinery) |
a plain object or a bare function: attachTransport((record) => …) |
logger.child({ requestId }) |
child({ bindings: { requestId } }) — or skip per-request children: runInContext({ requestId }, fn) |
| flushing on shutdown (long-standing footgun) | await logger.flush(), await using, and built-in exit-hook drains |
Gotchas. %s-style splat interpolation is not supported — log fields instead of format strings. handleExceptions / handleRejections have no equivalent — register process.on("uncaughtException", (err) => logger.fatal(err)) yourself. And winston’s default logger silently drops everything until a transport is added; tslog always has working output, so if you relied on that silence, use type: "hidden".
From consola
Section titled “From consola”consola and tslog agree that dev logs should be beautiful; tslog adds the production half — structured JSON, masking, transports, correlation. The mechanical mapping:
// ── consola ──import { consola } from "consola";const logger = consola.create({ level: 4 }).withTag("build");logger.start("building…");logger.success("done");logger.error(new Error("boom"));
// ── tslog v5 ──import { createLogger } from "tslog";const logger = createLogger({ name: "build", minLevel: "DEBUG", // installs a typed logger.success() customLevels: { SUCCESS: 3.5 },});logger.info("building…");logger.success("done");// pretty error, parsed stack, cause chainlogger.error(new Error("boom"));| consola | tslog v5 |
|---|---|
level: 0…5 (higher = more verbose) |
minLevel by name: consola 3 (default) ≈ "INFO", 4 ≈ "DEBUG", 5 ≈ "TRACE"; -999 (silent) ≈ type: "hidden" |
withTag("build") |
child({ name: "build" }) — names accumulate in _logMeta.parentNames |
success / ready / start / fail types |
map onto info / error, or install real levels via customLevels |
consola.box("…") |
box() / tree() from tslog/pretty/box: logger.info("\n" + box("Deployed!", { title: "release" })) |
| reporters | transports: attachTransport({ format, write }), with per-transport format |
consola.wrapConsole() |
wrapConsole(logger) from tslog/console (undo with restoreConsole()) |
| fancy ↔ basic auto-detect | pretty everywhere, env-aware color — colored on a TTY, uncolored when piped/CI; structured JSON is opt-in via type: "json" |
consola.prompt() |
out of scope for a logger — keep consola or a prompt library for interactive prompts |
Whichever logger you come from, createTestLogger from tslog/testing captures records and rendered lines, so you can assert the migrated output still matches what your pipeline expects before flipping the switch.
Upgrading from v4?
Section titled “Upgrading from v4?”Move to v5 when you actually want its new capabilities: opt-in structured JSON output, the flat fields-first JSON shape, grouped settings, use() middleware, per-transport level/format, the presets, and the AI/agent DX. v5 is ESM-only and requires Node ≥ 22 (≥ 20 up to 5.1).
👉 Full guide: MIGRATION_v4_to_v5.md — it maps every removed v4 setting (stylePrettyLogs, prettyLogTemplate, maskValuesOfKeys, metaProperty, hideLogPositionForProduction, the whole overwrite.* family, …) to its v5 replacement.